BIZ-OMICS
Business Studies: Economies of Scope Visualiser
Business Studies: Economies of Scope Visualiser
Couldn't load pickup availability
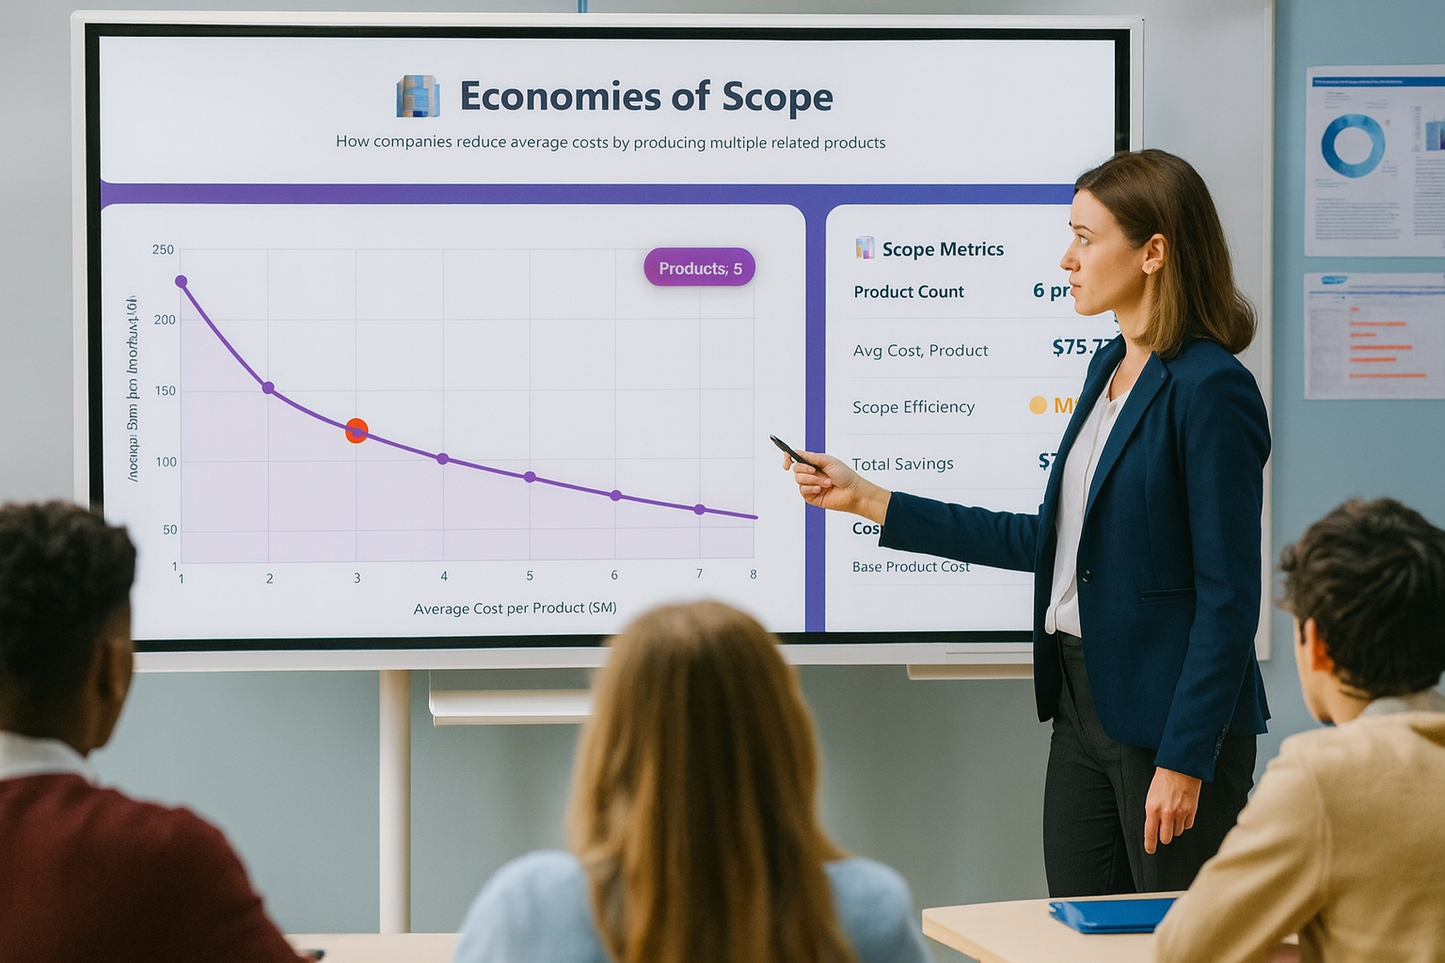
This interactive lets students manipulate a firm’s product range and watch how average cost per product changes when multiple related products share inputs and capabilities. The main chart shows shared versus standalone costs alongside the evolving average cost line, so learners can literally see scope efficiencies emerging as product count rises. A live readout tracks product count, average cost per product, overall “scope efficiency,” total savings, and a cost breakdown; these update instantly as students add or remove products. There’s also a “Cost Structure Analysis” panel that turns the sources of savings into simple bars, plus a contextual explanation area that can surface company case studies. Together, these elements turn an abstract idea into an immediate visual story of why related diversification can lower costs.
In terms of outcomes, students consolidate AO1 knowledge by defining economies of scope and distinguishing shared from standalone costs as they read the legend and metrics. They practice AO2 application by linking the on-screen shifts to specific sources of synergy in the explanation/company panels. AO3 analysis develops as they interpret how each additional product moves the average cost and decomposes into component savings via the breakdown and synergy bars. Finally, AO4 evaluation is encouraged when learners argue, with evidence from the display, about the point at which extra product lines cease to deliver net savings.
Share


