BIZ-OMICS
Business Studies: Strategic Growth Studio
Business Studies: Strategic Growth Studio
Couldn't load pickup availability
This bundle costs less than purchasing the three products individually.
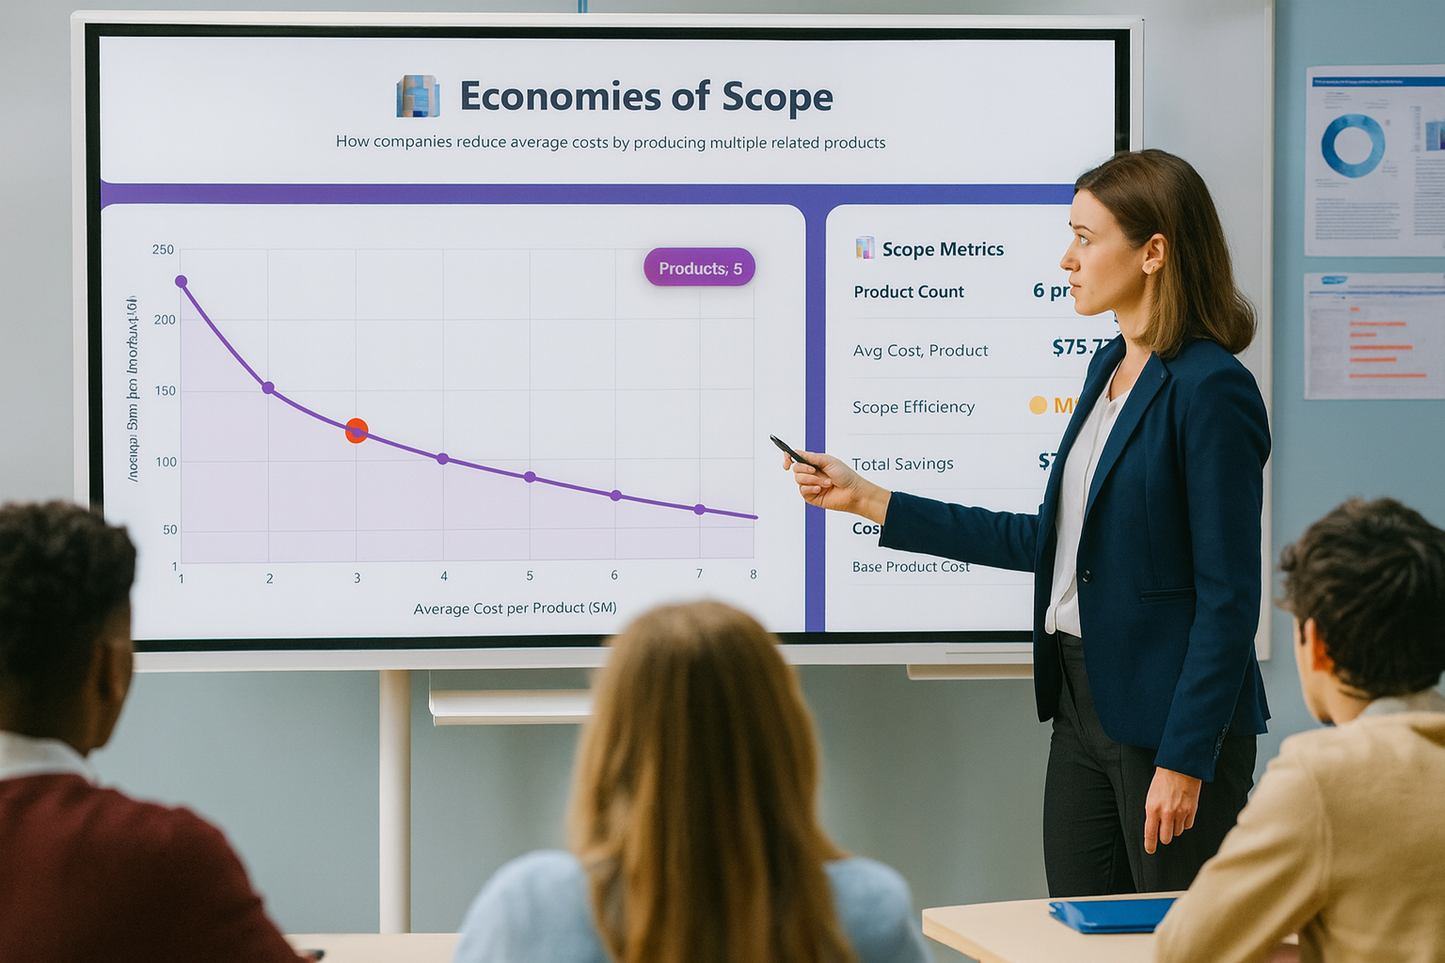
Economies of Scope Visualiser
This interactive lets students manipulate a firm’s product range and watch how average cost per product changes when multiple related products share inputs and capabilities. The main chart shows shared versus standalone costs alongside the evolving average cost line, so learners can literally see scope efficiencies emerging as product count rises. A live readout tracks product count, average cost per product, overall “scope efficiency,” total savings, and a cost breakdown; these update instantly as students add or remove products. There’s also a “Cost Structure Analysis” panel that turns the sources of savings into simple bars, plus a contextual explanation area that can surface company case studies. Together, these elements turn an abstract idea into an immediate visual story of why related diversification can lower costs.
In terms of outcomes, students consolidate AO1 knowledge by defining economies of scope and distinguishing shared from standalone costs as they read the legend and metrics. They practice AO2 application by linking the on-screen shifts to specific sources of synergy in the explanation/company panels. AO3 analysis develops as they interpret how each additional product moves the average cost and decomposes into component savings via the breakdown and synergy bars. Finally, AO4 evaluation is encouraged when learners argue, with evidence from the display, about the point at which extra product lines cease to deliver net savings.
Economies & Diseconomies of Scale Visualiser
This tool models the classic U-shaped average cost story as scale grows, but it adds clarity by marking the Minimum Efficient Scale (MES) range right on the chart and shading the economies and diseconomies regions. A live metrics panel shows output scale, current average cost, trend direction, and status, while a slider moves production along the curve. Crucially, students can toggle individual causes—purchasing power, technical efficiency, management, marketing, finance, along with coordination, communication, bureaucracy, and motivation—to see how each force pushes costs up or down at different scales. A waterfall-style breakdown reveals which causes dominate at the selected output, and preset scenarios (fast food, manufacturing, large corporation, startup) jump learners to realistic combinations so they can compare sectors quickly and discuss why costs differ.
Pedagogically, this supports AO1 by anchoring definitions of internal economies/diseconomies and the role of MES in long-run average cost. AO2 is strengthened when learners load scenarios that mirror real industries and justify why, for example, fast food benefits early from purchasing power while large corporates tip into bureaucracy at high scale. AO3 follows from reading the cost breakdown to explain causality—how the model’s parameters translate into the observed average cost at a given output. AO4 evaluation emerges as students decide whether a firm should expand toward MES or pull back from rising diseconomies, citing the on-screen evidence they’ve configured.
Build Your Franchise Empire
This is a lightweight strategy simulation where students act as CEO of a fast-food chain. A dashboard tracks KPIs such as cash, monthly revenue, number of restaurants, brand strength, and market share, while a three-pane layout presents actions (marketing, product, supply chain, training, acquisitions, international expansion, technology), a territory grid for openings, and an events/news feed that injects shocks and opportunities. Under the hood, transparent configuration tables for costs and multipliers make it clear how decisions translate into revenue, profit, brand, and customer effects; the welcome flow and notifications scaffold play, and a victory screen summarises performance over time with final stats and weeks to win. The design encourages short decision cycles—“Next Week” advances time—so learners can see immediate, model-driven consequences of their choices.
Share