The Five-Sector Economy Calculator is an interactive learning tool designed to bring the circular flow of income to life. It allows students to explore how changes in consumption, savings, taxation, investment, government spending and trade impact national income through the mechanics of leakages, injections and the multiplier effect. At its core, the calculator uses the marginal propensity to consume (MPC) and marginal propensity to withdraw (MPW) to illustrate how spending and withdrawals interact, automatically updating the size of the multiplier and showing the resulting change in GDP when new injections enter the economy. Users can experiment by adjusting values with sliders or direct inputs, breaking down MPW into savings, taxation and imports, and instantly seeing how the balance between injections and leakages affects overall economic activity. A built-in circular flow diagram responds dynamically, with flows and arrows adjusting to reflect the strength of the multiplier and the scale of consumption. By combining real-time calculations with clear visual cues, the calculator makes abstract macroeconomic concepts tangible, offering both clarity and engagement for students and educators studying the five-sector model of the economy.
BIZ-OMICS
Economics: Circular Flow of Income Bundle
Economics: Circular Flow of Income Bundle
Couldn't load pickup availability
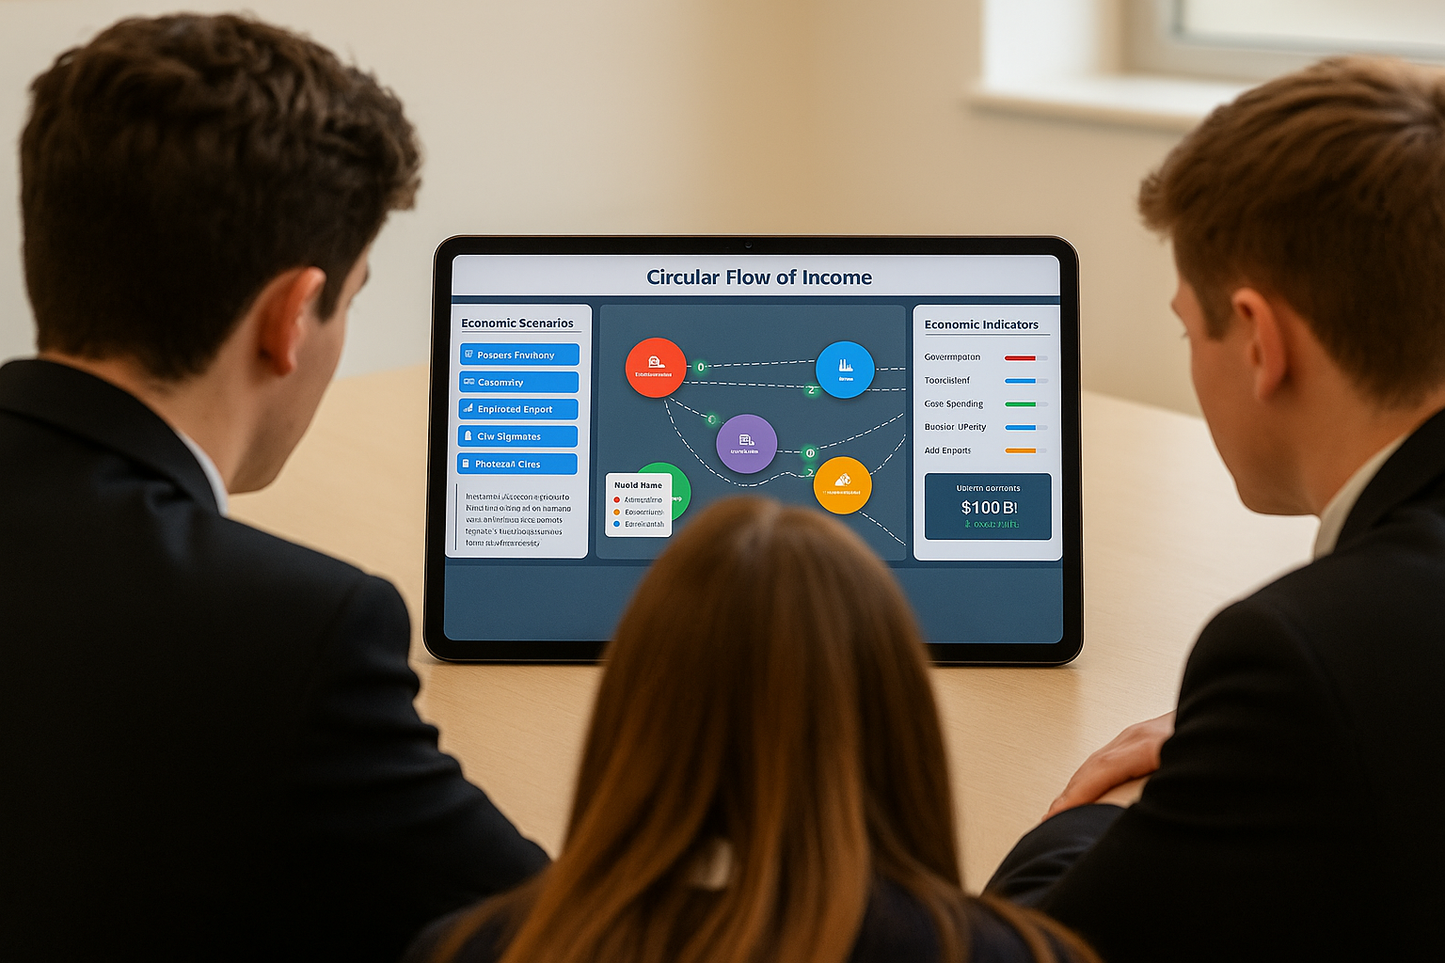
The Five-Sector Economy Calculator
Turn the circular flow of income from a static diagram into a living, breathing economy. With a tap, your class can jump between a steady-state “Normal Economy,” a crunch-time “Recession,” a roaring “Boom,” targeted “Gov. Stimulus,” or a “Financial Crisis,” and instantly see flows accelerate, slow, and reroute in response. Money tokens surge along the pathways between Households, Firms, Government, Finance, and International Trade, while a clean dashboard tracks the macro story in real time—consumption, investment, government spending, financial activity, net exports, national income, and growth all update as the scenario plays out.
It’s built for teaching moments: pause the action to narrate what’s changing and why, reset to compare scenarios back-to-back, or bump the speed when you want to dramatise overheating demand or a sudden credit squeeze. Learners don’t just “look at” injections and leakages—they watch wages, consumption, savings, investment, public spending and trade animate around the economy and feel how each component pushes GDP up or drags it down. Subtle hover effects and a colour key make the experience intuitive from the first glance, so your focus stays on explanation, not instructions.
Perfect for starters, walkthroughs, or revision, this visualiser turns abstract models into intuitive cause-and-effect, helping students link policy choices and shocks to visible changes in flows and indicators. Bring it up on the big screen, run a mini “policy lab” with stimulus vs. austerity, or let students predict the metrics before you hit play—either way, you’ll get heads up, hands raised, and aha-moments on cue.
Share