BIZ-OMICS
Economics: The Lemon Problem
Economics: The Lemon Problem
Couldn't load pickup availability
This HTML file creates an interactive simulation of George Akerlof’s “Market for Lemons” problem in economics, where buyers cannot easily distinguish between high-quality and low-quality goods. It is a teaching tool that blends layout, styling, and JavaScript logic to help learners understand how asymmetric information distorts markets.
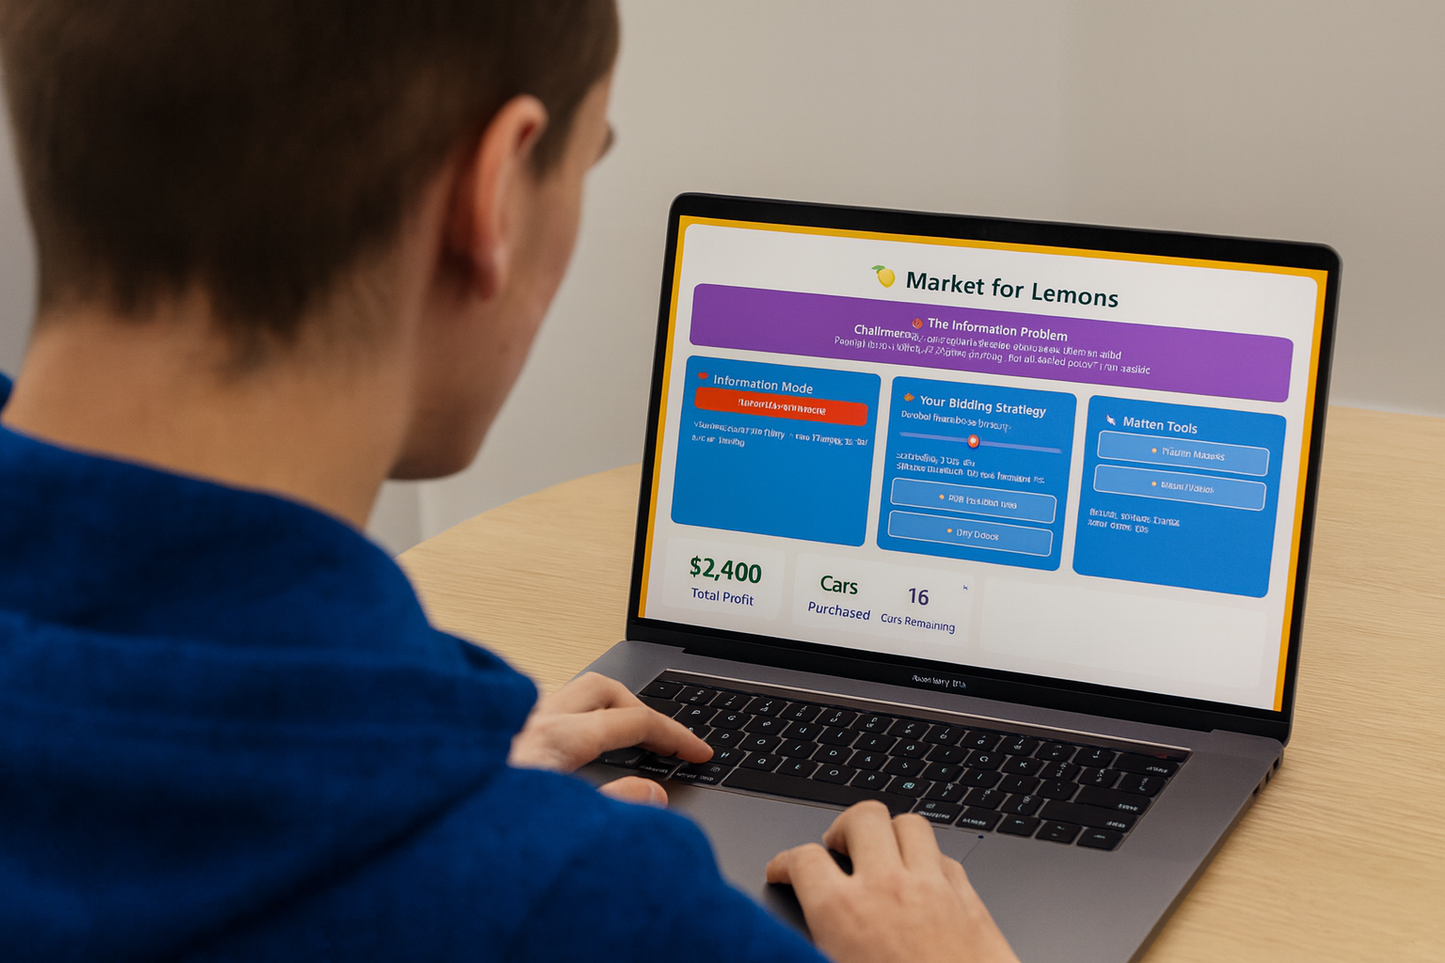
Structure and Visual Design
The page is styled with a vibrant, game-like interface. The background uses orange gradient tones to reference “lemons,” while individual sections use bold colors (purple for objectives, blue for controls, red for prices, etc.) to separate information clearly. A container holds the entire simulation, ensuring it remains centered and visually framed. Car icons (emojis 🚗 🚙 🚐) represent different quality categories of vehicles, while visual states (badges, color coding, fading when sold) communicate seller willingness and transaction outcomes.
Simulation Controls and Features
At the top, the learner sees the objective box, which sets the challenge: buyers must make profitable decisions without full knowledge of car quality. Controls are divided into three functional areas. First, the Information Mode toggle allows switching between “Asymmetric Information” (buyers cannot see car quality) and “Perfect Information” (buyers know true quality). Second, the Bidding Strategy panel contains a slider that lets learners set their willingness to pay, dynamically updating the displayed bid and the number of sellers willing to accept. Buttons allow them to buy a random car or multiple cars at once. Third, the Market Tools section enables market analysis, showing average values, and resetting the game to simulate new markets.
Market Display and Car Dynamics
The simulation generates 20 random cars with values drawn from high, medium, and low categories, each assigned a minimum acceptable price. The central market display shows the player’s current bid, the status of the market (active, no willing sellers, or exhausted), and the grid of cars. Cars update visually depending on whether they are unsold, willing to sell, or already sold. Under asymmetric information, car quality is hidden, reinforcing the information gap that the model seeks to illustrate.
Performance Tracking and Feedback
Beneath the display, stat cards update continuously to show total profit, number of cars purchased, cars remaining, and the success rate (profitable trades versus losses). A live transaction log records actions in natural language, noting purchases, profits, losses, and market analysis. This running commentary guides the learner through the consequences of their strategy.
Learning Outcomes
By interacting with the sliders and purchase buttons, students experience first-hand how asymmetric information creates market failure. They see that when buyers cannot distinguish quality, good cars may exit the market while low-quality “lemons” dominate, reducing overall efficiency. Switching to perfect information contrasts this effect, showing how transparent markets lead to fairer pricing and efficient trade. Learners not only gain a conceptual understanding of Akerlof’s theory but also build intuition through experimentation, observing patterns like adverse selection, bidding strategies, and the collapse of high-value goods in poorly informed markets.
Share